ENCINO, Calif. – November 14, 2019 – Research Solutions, Inc. (OTCQB: RSSS), a SaaS provider of workflow efficiency solutions for R&D-driven organizations, reported financial results for its fiscal first quarter 2020 ended September 30, 2019.
Fiscal First Quarter 2020 Highlights vs. Year-Ago Quarter
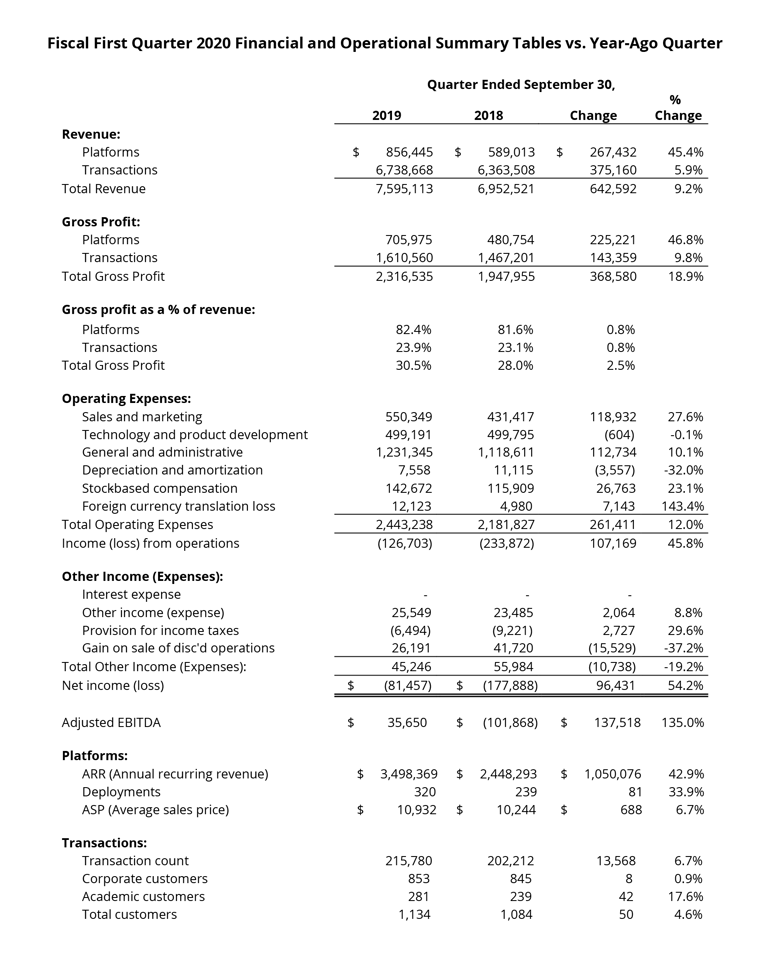
- Platform revenue up 45% to $856,000, with a 34% increase in total Platform deployments to 320. Annual recurring revenue up 43% to $3.5 million.
- Transaction revenue increased 6% to $6.7 million compared to $6.4 million, with customer count up to 1,134 compared to 1,084.
- Total gross margin up 250 basis points to 30.5%.
- Net loss from continuing operations was $0.1 million, or $nil per share, compared to a net loss of $0.2 million, or $(0.01) per share.
Management Commentary
“We got off to a strong start in fiscal 2020 with record gross margin due to both continued progress in our high-margin, SaaS-based Platform business and a return to growth in our Transaction business,” said Peter Derycz, president and CEO of Research Solutions. “During our first quarter, we shifted all marketing resources to focus on growing our enterprise customer base through business-to-business campaigns. We also implemented several new strategies to better optimize our lead nurturing practices, which have already been successful in driving conversion.
“Looking forward, we will continue to focus our efforts on marketing our Platform to potential enterprise clients, which we believe gives us the best opportunity to expand our customer base. We remain as confident as ever in our sales team and believe our narrowed focus and new enhancements to lead nurturing will accelerate Platform revenue growth.”
Fiscal First Quarter 2020 Financial Results
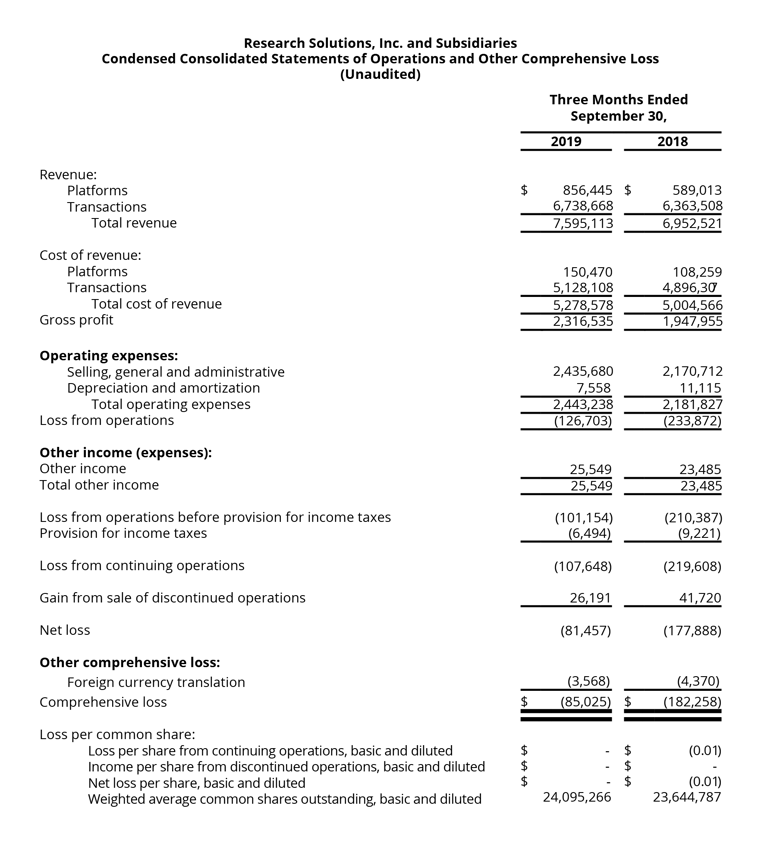
Total revenue increased 9% to $7.6 million compared to $7.0 million in the same year-ago quarter.
Platform subscription revenue increased 45% to $856,000 compared to $589,000 in the same year-ago quarter. The increase was primarily due to upselling current platform customers and to a 34% increase in the total number of paid Platform deployments from 239 to 320. The quarter ended with annual recurring revenue up 43% to $3.5 million (see the company's definition of annual recurring revenue below).
Transaction revenue increased 6% to $6.7 million compared to $6.4 million in the same year-ago quarter. Total active customers increased 5% from 1,084 to 1,134, and transaction count increased 7% from 202,000 to 216,000 (see the company's definition of active customer accounts and transactions below).
Total gross margin increased 250 basis points to 30.5% from 28.0% in the same year-ago quarter. The increase was primarily driven by a continued revenue mix shift to the higher-margin Platform business and an 80-basis point increase in both Transaction and Platform gross margin.
Total operating expenses were $2.4 million compared to $2.2 million in the same year-ago quarter. The increase was primarily a result of the continued investment in sales and marketing to expand the Platform business, along with greater professional service fees.
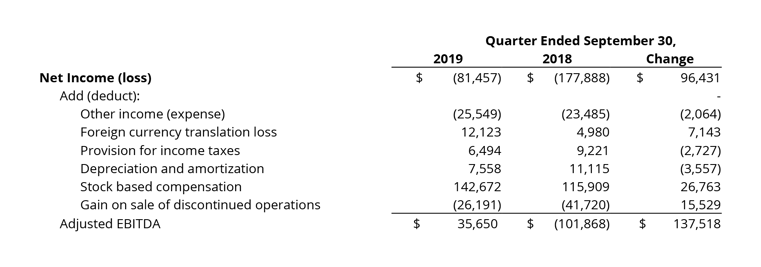
Net loss from continuing operations was $0.1 million, or nil per share, compared to a net loss of $0.2 million, or $(0.01) per share, in the year-ago quarter. Adjusted EBITDA totaled $36,000 compared to $(102,000) in the year-ago quarter (see definition and further discussion about the presentation of Adjusted EBITDA, a non-GAAP term, below).
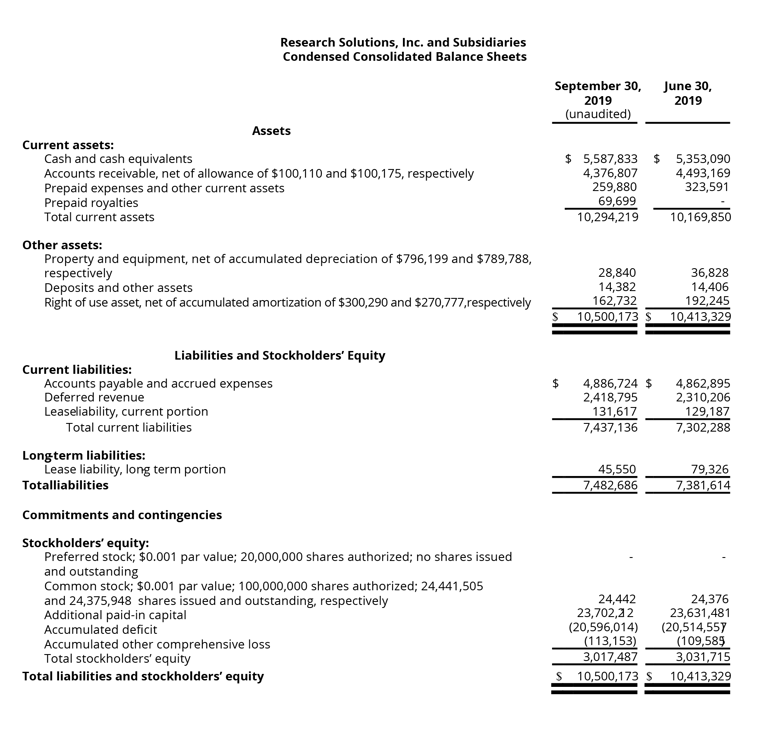
Cash and cash equivalents at September 30, 2019, amounted to $5.6 million compared to $5.4 million at June 30, 2019. There were no outstanding borrowings under the company’s $2.5 million revolving line of credit and the company had no long-term liabilities or other debt.
Further details about these results are available in the company’s annual report on Form 10-K, which is available in the investor relations section of the company’s website at www.researchsolutions.com.
Conference Call
Research Solutions President and CEO Peter Derycz and CFO Alan Urban will host an investor conference call to discuss these results and the company’s outlook, followed by a question and answer period.
- Date: Thursday, November 14, 2019
- Time: 5:00 p.m. Eastern time (2:00 p.m. Pacific time)
- Toll-free dial-in number: 1-855-327-6837
- International dial-in number: 1-631-891-4304
- Conference ID: 10007580
Please call the conference telephone number 5-10 minutes prior to the start time. An operator will register your name and organization. If you have any difficulty connecting with the conference call, please contact Gateway Investor Relations at 1-949-574-3860.
The conference call will be broadcast live and available for replay here and via the investor relations section of the company’s website at www.researchsolutions.com.
A replay of the conference call will be available after 8:00 p.m. Eastern time on the same day through December 5, 2019.
- Toll-free replay number: 1-844-512-2921
- International replay number: 1-412-317-6671
- Replay ID: 10007994
Active Customer Accounts, Transactions and Annual Recurring Revenue
The company defines active customer accounts as the sum of the total quantity of customers per month for each month in the period divided by the respective number of months in the period. The quantity of customers per month is defined as customers with at least one transaction during the month. A transaction is an order for a unit of copyrighted content fulfilled or managed in the Platform. The company defines annual recurring revenue as the value of contracted Platform subscription recurring revenue normalized to a one-year period.
Use of Non-GAAP Measure – Adjusted EBITDA
Research Solutions’ management evaluates and makes operating decisions using various financial metrics. In addition to the company’s GAAP results, management also considers the non-GAAP measure of Adjusted EBITDA. Management believes that this non-GAAP measure provides useful information about the company’s operating results.
The tables below provide a reconciliation of this non-GAAP financial measure with the most directly comparable GAAP financial measure. Adjusted EBITDA is defined as net income (loss), plus interest expense, other income (expense), foreign currency transaction loss, provision for income taxes, depreciation and amortization, stock-based compensation, gain on sale of discontinued operations, and other potential adjustments that may arise.
Set forth below is a reconciliation of Adjusted EBITDA to net income (loss):
About Research Solutions
Research Solutions, Inc. (OTCQB: RSSS) provides workflow efficiency solutions for R&D-driven organizations in life sciences, technology and academia worldwide. Our Software-as-a-Service platform provides tools or “Gadgets” that allow users to discover, access, manage and collaborate around science, technology and medical (STM) content and data. Our customers range from 70 percent of the top 25 global pharmaceutical companies to emerging small and medium-sized businesses. We generate recurring revenue from subscriptions to our SaaS platform and transactional revenue from the sale of STM content. For more information, visit www.researchsolutions.com.
Important Cautions Regarding Forward-Looking Statements
Certain statements in this press release may contain "forward-looking statements" regarding future events and our future results. All statements other than statements of historical facts are statements that could be deemed to be forward-looking statements. These statements are based on current expectations, estimates, forecasts, and projections about the markets in which we operate and the beliefs and assumptions of our management. Words such as "expects," "anticipates," "targets," "goals," "projects", "intends," "plans," "believes," "seeks," "estimates," "endeavors," "strives," "may," or variations of such words, and similar expressions are intended to identify such forward-looking statements. Readers are cautioned that these forward-looking statements are subject to a number of risks, uncertainties and assumptions that are difficult to predict, estimate or verify. Therefore, actual results may differ materially and adversely from those expressed in any forward-looking statements. Such risks and uncertainties include those factors described in the Company's most recent annual report on Form 10-K, as such may be amended or supplemented by subsequent quarterly reports on Form 10-Q, or other reports filed with the Securities and Exchange Commission. Readers are cautioned not to place undue reliance on these forward-looking statements. The forward-looking statements are made only as of the date hereof, and the Company undertakes no obligation to publicly release the result of any revisions to these forward-looking statements. For more information, please refer to the Company's filings with the Securities and Exchange Commission.
Investor Relations:
Gateway Investor Relations
Cody Slach
Tel 1-949-574-3860
RSSS@gatewayir.com
Media Contact:
Research Solutions, Inc. and Reprints Desk, Inc.
Leah Rodriguez
+1 (310) 477-0354
lsrodriguez@reprintsdesk.com

.png?length=400&name=Mark%20(1).png)