ENCINO, Calif. – February 14, 2018 – Research Solutions, Inc. (OTCQB: RSSS), a pioneer in providing cloud-based solutions for scientific research, reported financial results for its fiscal second quarter ended December 31, 2017.
Fiscal Second Quarter 2018 Summary vs. Year-Ago Quarter
- Total revenue increased 12% to $6.8 million.
- Platform revenue up 89% to $413,000, with a 92% increase in total Platform deployments to 184. Annual recurring revenue was up 89% to $1.7 million.
- Transaction revenue up 9% to $6.4 million, with customer count up 12% to 1,044. Transaction count up 6% to 205,019.
- Total gross margin up 280 basis points to 25.4%.
- Net loss from continuing operations was $0.7 million, or $(0.03) per share, compared to a net loss of $1.1 million, or $(0.05) per share.
Management Commentary
“Our second quarter showed continued robust growth in our SaaS-based Platforms offering, which helped support a strong quarter in our Transactions business,” said Peter Derycz, president and CEO of Research Solutions. “Version 2.0 of our Article Galaxy Platform went live in December and the early feedback on user experience has been quite positive. We look forward to completing the migration by March and implementing other major framework additions, like self-registration, in the next several months.
“We began the calendar year with a particularly strong month in our Platforms business, and look forward to building upon this momentum as the year unfolds. We expect this will be driven not only by the framework additions, but weekly improvements produced by our gadget factory, and a sales & marketing department we are refining to drive optimum efficiency and investment returns.”
Fiscal Second Quarter 2018 Financial Results
Total revenue increased 12% to $6.8 million compared to $6.1 million in the same year-ago quarter.
Platform subscription revenue increased 89% to $413,000 compared to $219,000 in the year-ago quarter. The increase was due to a 92% increase in the total number of paid Platform deployments to 184. The quarter ended with annual recurring revenue up 89% to $1.7 million (see the company's definition of annual recurring revenue below).
Transaction revenue increased 9% to $6.4 million compared to $5.9 million in the same year-ago quarter. Total active customers increased 12% from 936 to 1,044, and transaction count increased 6% from 193,000 to 205,000 (see the company's definition of active customer accounts and transactions below).
Total gross margin increased 280 basis points to 25.4% from 22.6% in the same year-ago quarter. The increase was driven by a 150 basis point increase in Transactions gross margin and a revenue mix shift to the higher-margin Platforms business.
Total operating expenses were unchanged at $2.4 million compared to the year-ago quarter, aligned with the company’s strategy to optimize its sales resources, including the reallocation of expenses and more efficient ways of acquiring customers through content generation and digital and inbound marketing.
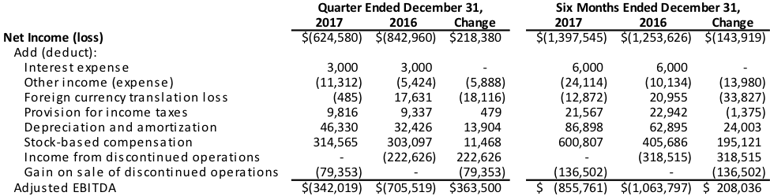
Net loss from continuing operations was $0.7 million, or $(0.03) per share, compared to a net loss of $1.1 million, or $(0.05) per share, in the year-ago quarter. Adjusted EBITDA totaled $(0.3) million compared to $(0.7) million in the year-ago quarter (see definition and further discussion about the presentation of Adjusted EBITDA, a non-GAAP term, below).
Cash and cash equivalents at December 31, 2017 were $4.9 million compared to $5.8 million at June 30, 2017. There were no outstanding borrowings under the company’s $2.5 million revolving line of credit. Apart from a $0.3 million office lease liability due to new accounting guidance for leases, the company had no long-term liabilities or other debt
Further details about these results are available in the company’s quarterly report on Form 10-Q, which is available in the investor relations section of the company’s website at www.researchsolutions.com.
Conference Call
Research Solutions President and CEO Peter Derycz and CFO Alan Urban will host an investor conference call to discuss these results and the company’s outlook, followed by a question and answer period.
- Date: Wednesday, February 14, 2018
- Time: 5:00 p.m. Eastern time (2:00 p.m. Pacific time)
- Toll-free dial-in number: 1-855-327-6837
- International dial-in number: 1-631-891-4304
- Conference ID: 10004236
Please call the conference telephone number 5-10 minutes prior to the start time. An operator will register your name and organization. If you have any difficulty connecting with the conference call, please contact Liolios Group at 1-949-574-3860.
The conference call will be broadcast live and available for replay here and via the investor relations section of the company’s website at www.researchsolutions.com.
A replay of the conference call will be available after 8:00 p.m. Eastern time on the same day through February 28, 2018.
- Toll-free replay number: 1-844-512-2921
- International replay number: 1-412-317-6671
- Replay ID: 10004236
Fiscal Second Quarter 2018 Financial and Operational Summary Tables vs. Year-Ago Quarter
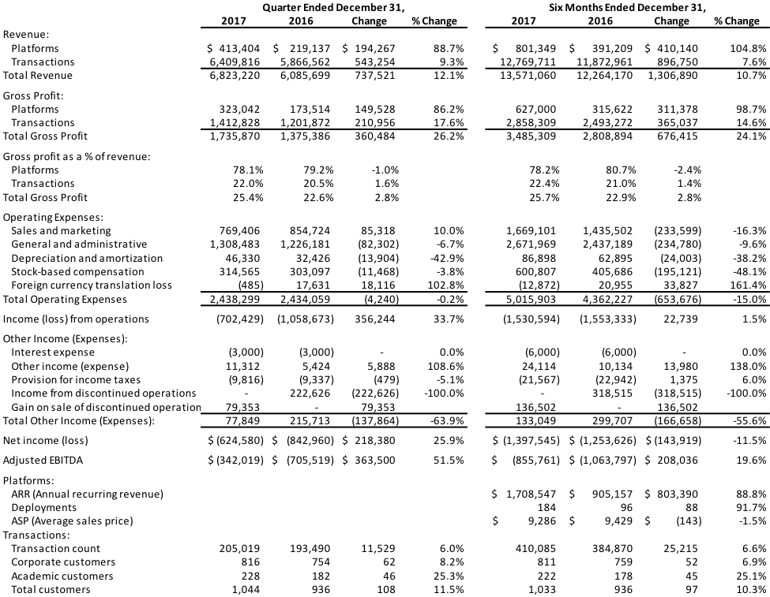
Active Customer Accounts, Transactions and Annual Recurring Revenue
The company defines active customer accounts as the sum of the total quantity of customers per month for each month in the period divided by the respective number of months in the period. The quantity of customers per month is defined as customers with at least one transaction during the month.
A transaction is an order for a unit of copyrighted content fulfilled or managed in the Platform.
The company defines annual recurring revenue as the value of contracted Platform subscription recurring revenue normalized to a one-year period.
Use of Non-GAAP Measure – Adjusted EBITDA
Research Solutions' management evaluates and makes operating decisions using various financial metrics. In addition to the company's GAAP results, management also considers the non-GAAP measure of Adjusted EBITDA. Management believes that this non-GAAP measure provides useful information about the company's operating results.
The tables below provide a reconciliation of this non-GAAP financial measure with the most directly comparable GAAP financial measure. Adjusted EBITDA is defined as net income (loss), plus interest expense, other income (expense), foreign currency transaction loss, provision for income taxes, depreciation and amortization, stock-based compensation, income from discontinued operations, gain on sale of discontinued operations, and other potential adjustments that may arise.
Set forth below is a reconciliation of Adjusted EBITDA to net income (loss):
About Research Solutions
Research Solutions, Inc. (OTCQB: RSSS) is a pioneer in cloud-based research intelligence and retrieval solutions for R&D-driven organizations. More than 70 percent of the top 25 pharmaceutical companies in the world rely on services delivered by Research Solutions’ wholly owned subsidiary Reprints Desk. The company’s Software-as-a-Service (SaaS) Platform provides customers with on-demand access to, and augmented data from, tens of millions of scientific, medical, and technical (STM) documents, helping them to accelerate acquisition at the point of discovery, save time and money, and remain copyright-compliant. For more information, visit www.researchsolutions.com.
Important Cautions Regarding Forward-Looking Statements
Certain matters discussed in this press release may be forward-looking statements. Such matters involve risks and uncertainties that may cause actual results to differ materially, including the following: changes in economic conditions; general competitive factors; acceptance of the company's products in the market; the company's success in obtaining new customers and new Platform deployments; the company's success in technology and product development; the company's ability to execute its business model and strategic plans; the company's success in integrating acquired entities and assets, and all the risks and related information described from time to time in the company's filings with the Securities and Exchange Commission ("SEC"), including the financial statements and related information contained in the company's Securities and Exchange Commission Annual Report on Form 10-K and interim Quarterly Reports on Form 10-Q. The company assumes no obligation to update the cautionary information in this release.


.png?length=400&name=Mark%20(1).png)