Data enrichment and knowledge graphs are the subjects of crucial discussions in the future of research. Here, we step back and look at graph databases and knowledge graphs from 30,000 feet to cover some of the basics about graph databases and knowledge graphs, and explains why they are valuable in scientific research.
Frequently cited examples of knowledge graphs are Facebook and LinkedIn, where the information about the people is valuable, but the connections between those people, or the network, has even more value. Similarly, the Google knowledge graph, which often populates the side panel in search results, aggregates connected information from multiple sources to provide a more comprehensive view of information on a given topic in one place.
Graph Databases
The easiest way to think of a graph database is to think of it as a database of connections. In LinkedIn’s case, we each have our first degree connections, those people with whom we’ve mutually agreed to connect, and second degree connections, who are people we haven’t connected with, but have connected with our connections. We can see our connections’ relationships, which can lead to serendipitous discovery, a germ of curiosity that may sprout to importance. This often sounds like the thought "that's interesting, I didn't know Vicky knows Roger." The LinkedIn graph database is a single database of all our connections or relationships.
The Google example is slightly different in that the connected information comes from different sources.
Google’s search results sometimes show information that comes from our Knowledge Graph, our database of billions of facts about people, places, and things. Facts in the Knowledge Graph come from a variety of sources that compile factual information. In addition to public sources, we license data to provide information such as sports scores, stock prices, and weather forecasts.1
As you can imagine, taking many disparate datasets, as Google does, and aligning them to instantaneously provide cohesive, relevant answers to billions of questions or search queries isn’t easy. The only database whose form aligns with the function of providing answers to relationship-based questions is the graph database.
A graph database stores relationships in a format known as a triple, composed of a subject, predicate, and object. Here are some examples:
| Subject | Predicate | Object |
| Diabetes | Is an indication for | Insulin |
 |
Is the chemical structure for | Insulin |
| A A Starke | Authored | Action profiles of fast onset insulin analogues |
| Acute MI Rates Differ wWith Two Insulins | is about | Insulin |
| Sir Frederick G Banting | Discovered | Insulin |
In the above table, the subject and the object are called nodes, which store data entities, and the predicate is called an edge, which stores relationships between entities.
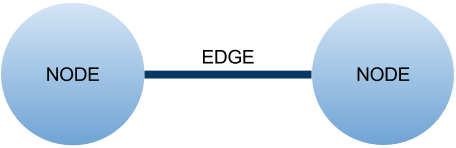
By storing the data as relationships, it becomes possible to search for and see connections between those relationships.
What Are the Benefits of Graph Databases?
Perhaps the biggest benefit offered by graph databases is that they eliminate data silos. They are by definition a way to connect disparate datasets which are prevalent in every company, and facilitate connecting proprietary data with public domain and third party datasets. Whereas SQL databases can connect data through various joins, the connections in graph databases are native. They are flexible and agile whereas other databases are structured but rigid. And graph databases are structured in a way where database growth, which often happens in unexpected directions, can be handled easily.
Graph databases are purpose-built for storing and analyzing relationships among the data, as the data entities and relationships among them are pre-connected.2
Other database technologies have been designed for efficiency in terms of storage, management, and retrieval of data, often with batch processing in mind. Graph databases are increasingly being used for machine learning applications and are designed to facilitate browsing to reveal unusual patterns and connections. The applications of the technology are so groundbreaking and far-reaching an entirely new field of graph data science has emerged.
The point of graph data science is to leverage relationships in data. Most data scientists work with data in tabular formats. However, to get better insights, to answer questions you can’t answer without leveraging connections, or just to more faithfully represent your data, graph is key.3
From Graph Databases to Knowledge Graphs
Knowledge graphs give you the tools to analyze and visualize the information in a graph database.
A knowledge graph, also known as a semantic network, represents a network of real-world entities—i.e. objects, events, situations, or concepts—and illustrates the relationship between them. This information is usually stored in a graph database and visualized as a graph structure, prompting the term knowledge “graph.”4
With data silos eliminated by storing data in a graph database, a knowledge graph can be used to analyze and visualize this data all in one place and in one application. Graph databases have their own query languages (GQLs) that allow seamless access to the relationships in the database. SPARQL, Cypher, and Gremlin are some examples of GQLs.5 GQLs are typically used to find relationships, and those relationships are displayed in a knowledge graph.
It’s easy to understand that data in silos is suboptimal, and that connecting disparate datasets could be advantageous. But there are other equally important benefits of graph databases and knowledge graphs beyond just silo breaking.
Flexibility: Structured and unstructured data can be used in concert in a knowledge graph. New datasets can be readily incorporated, meaning new insights can be garnered quickly. The database and tools are dynamic – they can be modified to meet new, unexpected use cases.
Context: Visualization of a network of connections can immediately provide context. At the center of the illustration below is Michael Houghton, one of the Nobel Prize winners in Physiology or Medicine in 2020 for discovering the Hepatitis C virus. Here we can see some of his network of co-authors of his research publications, and other topics he has researched and written about. A quick glance relays the context of his research activities.
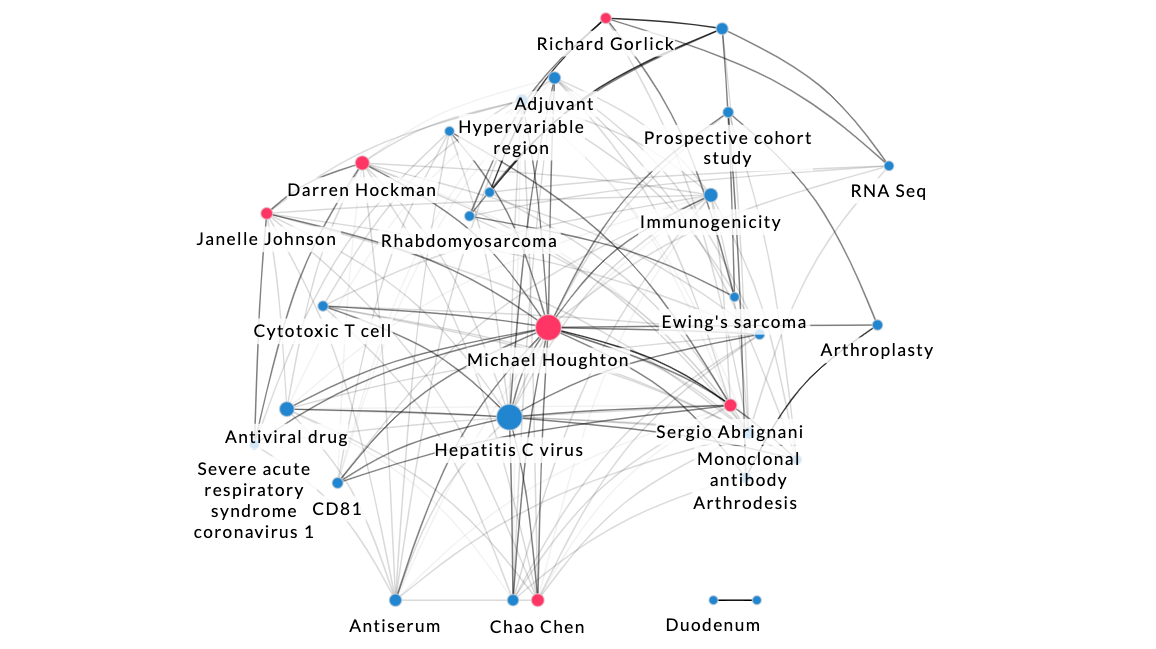
By connecting data from disparate sources it is much easier to understand changes in data, the development of trends, and relationships among people and entities.
Machine Learning: The best data science projects come from combining more than one source of data, often a nightmare for data scientists. The key advantage of a knowledge graph comes from relationships generated from combined data sources using ontologies and other metadata. Link prediction, or predicting the existence of a relationship between two entities in a network, and similarity searches based upon semantics are much more straightforward using a graph database. Whereas natural language processing (NLP) makes use of document vectors (mapping words or phrases from or to a corresponding vector of real numbers which are used to find word predictions, word similarities/semantics) knowledge graphs can make use of graph embeddings to allow clustering, more accurate node classification, next-item/sequence prediction, and link prediction, among other things.
Serendipity: Philosophers of metaphysics like Immanuel Kant appreciated space and time as modes of conceptualization in the mind of raw sensory inputs. Whether we are just pontificating philosophers like Kant and converting sensation and perceptions into concepts and knowledge, or thinking practically about tools for getting from data and knowledge to insights and breakthroughs, we intuitively know that visualization will get us to our goals faster. Neuroscientists have confirmed what Kant knew, that for everything from goal achievement to drawing key connections, the visual part of our brain is special. Data exploration inside a knowledge graph allows us to step directly into utilizing the part of our brain built for making insights, and could be seen not just as beneficial but necessary for making this happen regularly for ourselves and our colleagues.
Knowledge Graph Use Cases
There are several hardcore knowledge graph use cases, and more are being developed everyday. Beyond the social networking use cases deployed by Google and Meta, knowledge graphs are frequently used for:
- Fraud Detection: This is in part “suspicion by association” where risky counterparties are identified by their association with known bad counterparties or by detection of connectivity patterns that are self-reinforcing in a fraudulent manner. Another use case is similarity searches based upon identity or behavior. There are many firms using knowledge graphs to reduce fraud and trigger enhanced due diligence. Allianz is one example.
- Supply Chain Analysis: Identifying connections in different parts of a supply chain is critical in overcoming disruptions. If part of a supply chain goes down, it is clearer to see the knock-on effects if the information can be visualized in a graph. In addition it’s easier to find alternate sources of supply.
- Recommendation Engines: Amazon and Netflix each incorporate a recommendation engine in their service. These are effectively driven by knowledge graphs where a profile of every user is created, and then profiles can be matched with other content a user has purchased or rated highly. In other words, a content profile. While this idea existed before in the form of matrix factorization, a non-graph-based algorithm, graphs improve upon this by incorporating usage patterns of users, which is not readily available with alternate data structures. A post on how this works is available here.
In the sciences, knowledge graphs are being used for a variety of purposes, drug repurposing being at the top of the list. There are dozens of medical, chemical, and drug related databases that need to be connected and analyzed for drug repurposing and discovery, and knowledge graphs make it possible.
The sheer amount and heterogeneity of these data poses a major challenge: data integration and, based thereupon, the integrative analysis of these data.6
At the basic level, the visual nature and ease of navigation through a large corpus of data are obvious benefits of knowledge graphs. But data silos are a hidden plague in most organizations, and knowledge graphs are a fast and effective tool to eliminate silos and bring disparate datasets together. Connected information is certain to generate better insight and intelligence. Finally, by applying machine learning to a graph, unseen connections and trends can be revealed that immediately add value and can lead to repeatable “aha” moments.
Enhancing Innovation Workflows: Research Solutions Acquires ResoluteAI
Research Solutions has acquired ResoluteAI, an intelligent search platform powered by Artificial Intelligence (AI) and Natural Language Processing (NLP), to bring the latest technological advancements directly to our valued users and empower them to fully harness AI capabilities. As a result of this acquisition, we will be integrating ResoluteAI's advanced search tools into Article Galaxy within the upcoming months. These features encompass a more robust search functionality utilizing industry-specific taxonomies, leveraging ResoluteAI's proprietary knowledge graph.
Experience the power of our AI-powered tools and book a demo today to see Foundation and Nebula in action. Our dedicated team is eager to demonstrate how our products can elevate your research.

- https://support.google.com/knowledgepanel/answer/9787176?hl=en
- https://www.tigergraph.com/blog/what-is-a-graph-database-and-why-should-you-care/
- https://venturebeat.com/business/graph-data-science-what-you-need-to-know/
- https://www.ibm.com/cloud/learn/knowledge-graph
- https://memgraph.com/blog/graph-database-query-languages-you-should-try
- https://www.researchgate.net/publication/37683649_BN_-_A_Biological_Information_System